Coincident SMOS, SFMR, and Sentinel 1A probing of Category 4 Hurricane Dorian surface winds
Hurricane Dorian (24th of Aug to 10 Sep 2019) was an extremely powerful and devastating Category 5 Atlantic hurricane, that became the most intense tropical cyclone on record to strike the Bahamas.
Dorian developed from a tropical wave on August 24 over the Central Atlantic. The storm moved through the Lesser Antilles and became a hurricane north of the Greater Antilles on August 28. Dorian proceeded to undergo rapid intensification over the following days to reach its peak as a Category 5 hurricane with one-minute sustained winds of 82 m/s (295 km/h) and a minimum central pressure of 910 millibars (26.87 inHg) by September 1. It made landfall in the Bahamas in Elbow Cay, just east of Abaco Island, and again on Grand Bahama several hours later, where it remained nearly stationary for the next day or so. After weakening considerably, Dorian began moving northwestward on September 3, parallel to the east coast of Florida. Dwindling in strength, the hurricane turned to the northeast the next day and made landfall on Cape Hatteras at Category 2 intensity on September 6. It transitioned into an extratropical cyclone before striking first Nova Scotia and then Newfoundland with hurricane-force winds on September 8. It finally dissipated near Greenland on September 10.
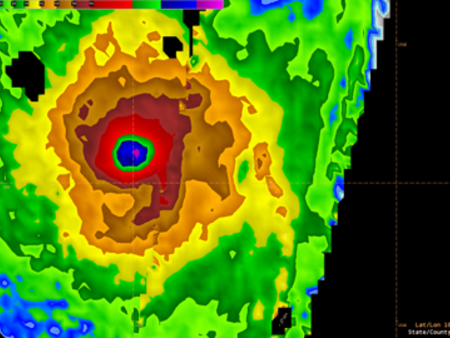
On the 30th of August evening as the hurricane was rapidly intensifying and reaching Category 3 on the Saffir-Simpson Scale (Vmax=57 m/s), SMOS (22:47) and Sentinel 1-A (22:45) intercepted the storm to provide two independent estimates of the surface wind speed in the hurricane with a 2 mn time lag. In addition, a NOAA hurricane hunter flight (NOAA_SFMR20190830H2) provided concomittant surface wind data estimated from the Step Frequency Microwave Radiometer (SFMR) instrument, an airborne remote sensing instrument designed for NOAA operational surface wind estimation in hurricanes. This triple co-locatizaton of surface wind speed derived over an extreme event from SMOS/SFMR/S1A, which are fairly different instruments (mono/multi frequency, active/passive, high versus low spatial resolution, etc..) as well as relying on specific retrieval algorithms ) provide a unique opportunity to observe the respective sampling characteristics and complementarity of each instrument for Tropical Cyclone monitoring.
Surface Wind Speed retrieved from top SMOS and Sentinel 1A (background color) superimposed with SFMR winds along the NOAA flight track. The storm center track is shown as black or white dots
As shown above, SMOS and Sentinel 1A intercepted the storm as the NOAA aircraft arrived in the most intense wind region in the North West quadrant of the storm and the aircraft reached the eye region a quarter after SMOS & S1A intercepts.
The SMOS data interpolated along the SFMR flight track and evaluated as a function of the time difference between SMOS and SFMR data along the aircraft track are shown above. The High Resolution (HR) SFMR surface wind and rain rate data are shown in black and grey, respectively. The SMOS neareast retrievals are shown in blue. The pink curve is showing the SFMR data averaged at the spatial resolution of SMOS (~43 km). Except for the time lag between -0.5 and -0.25 h where SMOS SWS is lower than SWS from SFMR, SMOS data are in general well matching the SFMR flight data. The spatial resolution smearing of SMOS is seen to strongly damp the high wind gradient structure around the storm eye. Note that SMOS seems a different location of the maximum (in the southeast quadrant) wih respect SFMR (in the NW quadrant). S1A intercepted the southeasternmost part of the storm 2 mn before, as illustrated below:
The SAR wind retrieval from S1A is also in general in very good agreement with SFMR High resolution wind. Differences are noticeable in the eye region, with a small displacement in the inner core which might be due to the storm center translation during the time lag in between SFMR & S1A/SMOS data (not corrected for). The SAR show a significantly higher Vmax, but consistently with SMOS it is located in the SEQ rather than in the NWQ as in the SFMR, but overall the agreement between these 3 instruments is very encouraging to build up a consistent high wind data set. In particular, combined high resolution SAR and low resoultion SMOS brings the following parameter of interest to operations, such as the maximum wind and wind radius (S1,SFMR), the radii at 34, 50 and 64 kt per quadrant.


